|
|
|
|
 Swiftech MCW-Chill452 Review Swiftech MCW-Chill452 Review
|
|
Date Posted: Apr 27 2004
|
|
Author: pHaestus
|
|
|
|
|
Posting Type: Review
|
|
Category: H2O and High End Cooling Reviews
|
|
Page: 2 of 3
|
|
Article Rank:No Rank Yet
Must Log In to Rank This Article
|
|
|
|
|
Note: This is a legacy article, imported from old code. Due to this some items on the page may not function as expected. Links, Colors, and some images may not be set correctly.
|
|
|
Swiftech MCW-Chill452 Review By: pHaestus
|
|
I tested the MCW-Chill extensively over several weeks and so we have a lot of ground to cover here. Some of the things that I learned from testing are
generally of use to those using chilled water while others specifically relate to the MCW-Chill's performance. If you are only interested in "how cold did it get" or "how high could you overclock with it" then just skip to the next page.
If you are more interested in the testing and design parameters that affect performance then please read on.
Also be aware that this is real data collected in my basement so there is some noise and deviation from a "perfect fit" to theory sometimes.
Let's begin with the first tests that I conducted: Testing the MCW-Chill with conditions as close as possible to Bill Adams' official testing at Swiftech.
This requires a little bit of mathematical manipulation since I cannot directly measure the wattage of the CPU. What CAN be measured for my system with good precision by both Bill and me are air and water
temperatures. In Bill's testing the water temperature on the hotside loop was fixed at 35C with a recirbulating laboratory chiller, and as more heat was added into the loop by increasing die simulator W then the chilled
water temperature began to rise. If one plots Bills data in the form of Delta T (hotside water – chiller output water) vs. W, a relationship can then be established:
|
|
Delta T (hot - chill) = -0.0007*W2 - 0.0543*W + 40.371 R2 = 0.9985
|
|
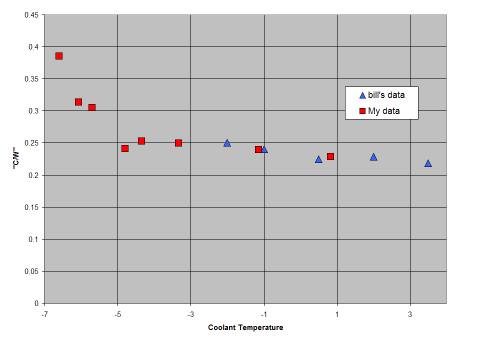
A 2nd order polynomial was used to improve the R2 of the result. With this equation and Excel's Goal Seek function one can estimate W for my chiller tests by using the experimental hotside water temp and chiller outlet water temp and solving for W. I tested over a range of W by running CPU at 2200MHz and 1.6-2V and then for the last point I tested at 2084MHz and 1.6V. Here are the results:
|
|
 |
|
That's a pretty good agreement, but please be aware that by cross-correlating with Bill's data I more or less guaranteed that they would scale pretty
similarly. What is interesting here is that C/W does NOT seem to be fixed in either my testing or Bill's as coolant temperatures drop below 0C. Why would this be? There are two main reasons that this could
occur. The first is an imperfect insulation of hoses, waterblock, and motherboard on the chilled water loop. The second is a change in viscosity that affects heat transfer as coolant temperatures approach the
freezing point. In retrospect I should have given methanol or a methanol/water mix a shot as a coolant. I didn't because I had the antifreeze lying around.
|
|
|
|
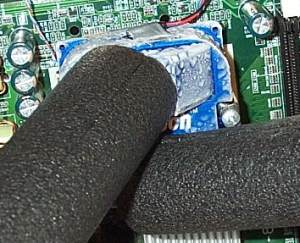
It is virtually impossible to put together a perfectly insulated system for testing purposes when using a PC as a heat source. The CPU
waterblock frosts over pretty quickly as coolant temperatures decrease; obviously some cooling efficiency is being lost by that path. This can be dealt with using insulation though as can losses from the hoses
and fittings and reservoirs and pump of the chilled loop.
Even if that is done, though, it isn't so easy to insulate our CPU from all of the secondary heat sources in the system. It's important to
consider that the CPU is in contact with motherboard traces, and that those traces can affect the chiller's effectiveness at extremely low coolant temperatures. One must consider that
|
|
|
everything is in thermal equilibrium at steady state, and as you decrease the temperature of the CPU face then heat will flow increasingly from VRMs and
northbridge and electronics onboard. It could be argued that this is potentially a good thing though: Suppose one uses a CPU, northbridge, and GPU waterblock all in a loop with chilled water. I would expect that
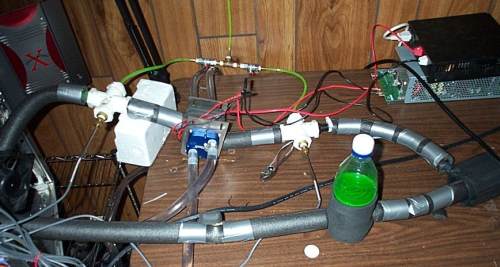
memory stability and voltage regulation would be improved as a result because of secondary cooling. So my next step in testing was to try and insulate the chiller loop as well as I could. I used foam pipe insulation
purchased from a home improvement store and some duct tape.
|
|
|
 |
|
|
Performance was much better after cold side loop insulation. So much better that I had to increase the amount of antifreeze in the loop or my coolant
would freeze. Coolant temperature in an insulated loop can easily drop below -10C idle; we are now in the realm of real man cooling ™. Along with foam insulation, people using chillers quite often
use case fans blowing over the socket area to try and minimize condensation. I gave this a try as well, and while it does limit the amount of frost on the CPU waterblock, it also results in CPU diode temperatures of about
2-3C higher. Proper insulation of the CPU and socket area (rather than relying on airflow) is an easy way to improve performance if you are using chilled water.
With the loop insulated and my coolant properly fortified with ethylene glycol, I could begin serious chiller performance testing. I will now present
results from three different scenarios:
|
|
Chiller Performance vs. Chilled Loop Flow Rate
|
|
This is a parameter that an end user would vary by choosing an appropriate pump, and that I tested by plumbing a ball valve into the chilled loop. An
Eheim 1048 was used for all chiller testing. The effect of flow rate is illustrative of the difficulty in testing out the MCW-Chill. It is very difficult to isolate a single variable for testing with such a
complicated system.
|
|
Starting with the simplest measurement, one can clearly see that coolant temperature decreases markedly as flow rate increases from 0.3-1.4
L/min. This makes sense to me because turbulence (and Reynold's number) should be increasing quite a bit inside the chiller as flow increases, and I wouldn't be surprised if a transition from laminar towards a
turbulent flow regime was occurring. We already know that increasing flow rates improve waterblock performance, so it is not at all surprising that the middle graph (delta T vs. flow) improves as flow rate
increases. What IS surprising to me is that the increase is much less marked than the coolant temperature vs. flow graph discussed above. And when C/W is calculated (using the correlation with Bill's test
data to estimate W), there is very little change with flow rate (perhaps a slight linear decrease). How can this be? One would expect the delta T (CPU-coolant) and C/W graphs to be very similar in
shape. In fact, though this isn't the case with the chiller. We may have enhanced losses from the imperfect insulation and from the increasing temperature differential between the CPU and the motherboard,
and heat flows from the motherboard's traces through the CPU pins into our coolant loop. So W is changing at every flow rate, while the chiller loop's C/W remains fairly consistent.
|
|
|
|
Performance vs. CPU Power
|
|
In the following tests, flow rate was not throttled with valves and performance was measured as CPU VCore or MHz changed. Nonetheless, flow rates are
expected to decrease as coolant temperatures drop due to increasing fluid viscosity. Therefore when testing the performance of the chiller as a function of applied load, one interesting place to start is how coolant
temperature and flow rate are related. It can be seen that the flow rate of the coolant drops from ~ 1.35L/min at -3C to ~1.18L/min at -9C. This is regardless of whether CPU VCore or MHz is changed, suggesting it is
a true physical effect of temperature on the coolant.
|
|
|
 |
|
|
While it's certainly interesting to see the effects of coolant temperature on flow rate, but of more direct importance is how well the chiller performs as CPU
power changes. To get at this information, it is possible to graph the MCW-Chill's performance as "Heat extracted vs. flow rate" in a manner analogous to Bill's radiator testing. To convert the test results to W,
the following equation was used:
|
|
W = 69.5466*flow rate (L/min)*deltaT (chiller in - out)
|
|
We can then graph the heat extracted from the coolant vs. CPU voltage or frequency. Another interesting parameter to plot on the same graph is the
temperature difference between the hot-side loop coolant and the chiller coolant. This should decrease as we add W to the chilled loop from the CPU.
|
|
 |
|
|
|
This seems to follow the correct general trend: as W increases then the difference between the chiller outlet temperature and the hotside water temperature
decreases. It also seems that a generally linear relationship between MHz and VCore and W can be fitted through the results. You can also see that there is potential to use test results from my system to produce a
"radiate" style application based upon real data; a project for another day I think though.
Another item to note is that it's certainly possible to hold the hot side water temp to 35C or less with heatercores and 120mm fans. That means that even
a 150W CPU (such as Prescotts) should easily be held to no more than 10C under load.
These results are honestly the tip of the iceberg.
There is a full history of my MCW-Chill testing, complete with hardware issues, general stupidity on my part, and some extremely insightful modeling and comments from Les and others. Check it out for a wealth of good information.
|
|
The End Is Near!
 |
|
|
|
|
| Random Forum Pic |
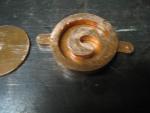 |
| From Thread: Post pictures of your homebuilt blocks here! |
|
| | ProCooling Poll: |
| So why the hell not? |
|
I agree!
|
 67% 67%
|
|
What?
|
 17% 17%
|
|
Hell NO!
|
 0% 0%
|
|
Worst Poll Ever.
|
 17% 17%
|
Total Votes:18Please Login to Vote!
|
|